
Price isn’t the only thing anymore.
Ternio Newsroom Staff | May 2023
The Surgical Waste Problem
The number of medical supplies that go unused and discarded after surgeries is truly mind-boggling. Items ranging from surgical gloves, to sponges and medications are routinely thrown out. These items have been included on the surgeon’s preference card taken into the OR, but not used.
A 2016 study[i] at the University of California, San Francisco and published in the Journal of Neurosurgery put a price tag on this waste: nearly $1,000 per procedure. Blue towels, gloves and sponges were among the most unused and discarded supplies in this study, with the most expensive item wasted being “surgifoam,” a sponge used to stop bleeding. The cost of one such sponge in 2016 was close to $4,000. One of the surgeons in this study estimated that he performs about 400 procedures annually. With an average $1,000 in wasted or discarded supplies per procedure, that’s approximately $400,000 annually in wasted supplies. For just one surgeon.
Global consulting firm PwC estimates that 3-5% of overall supply cost or perioperative and interventional cases is supply waste due to lack of maintenance and management of physician preference cards.[ii]
A Johns Hopkins research study[iii] estimated that about 2 million pounds of supplies, valued at close to $15 million are wasted every year in the surgical setting in the US. If you do the math from the UC, San Francisco study referenced earlier, this number is probably low.
Translating “Results” Into Savings
Cloud-based preference card solutions such as PrefConnect have traditionally been able to provide usage recommendations and report the “results” of those recommendations. For example, PrefConnect identifies and reports that a certain item on the preference card has been taken into 100 procedures but has only been used 5 times. It recommends removal of that item. Assuming the recommendation to remove the item is accepted, a “result” is generated based on the cost of that item times the number of times it was included but not used (wasted). In this example, a removed item valued at $5 that had been on a card but not used 100 times would generate a “result” of $500. Of course, real world results far exceed the number cited in this example. A prominent hospital system in the Pacific Northwest has seen cumulative annual results of more than $3,000,000. Impressive as these “results” may be, until recently the stubborn question of how this translates into savings remained. How can hospitals measure and validate the actual savings that accrue from improvements in supply utilization?
Collaborating closely for more than 6 months with a 6 hospital system in the Pacific Northwest, PrefConnect set out to address this need. Together we established and agreed upon the relevant data analysis and the reporting format. Tapping into PrefConnect’s historical utilization data for the agreed time period, over 2,900 line item edits were completed and analyzed. We then compared pre-recommendation acceptance data to post recommendation acceptance data for a comparable period of time. The delta between these two figures reflected dramatic, quantified, validated savings:
-
-
-
- >2,900 items analyzed
- Total validated utilization savings: >$400,000 (annualized)
- Total validated waste savings: >$500,000 (annualized)
- ROI: >8x
-
-
Here is a detailed view of the utilization and waste reductions for just 12 items:
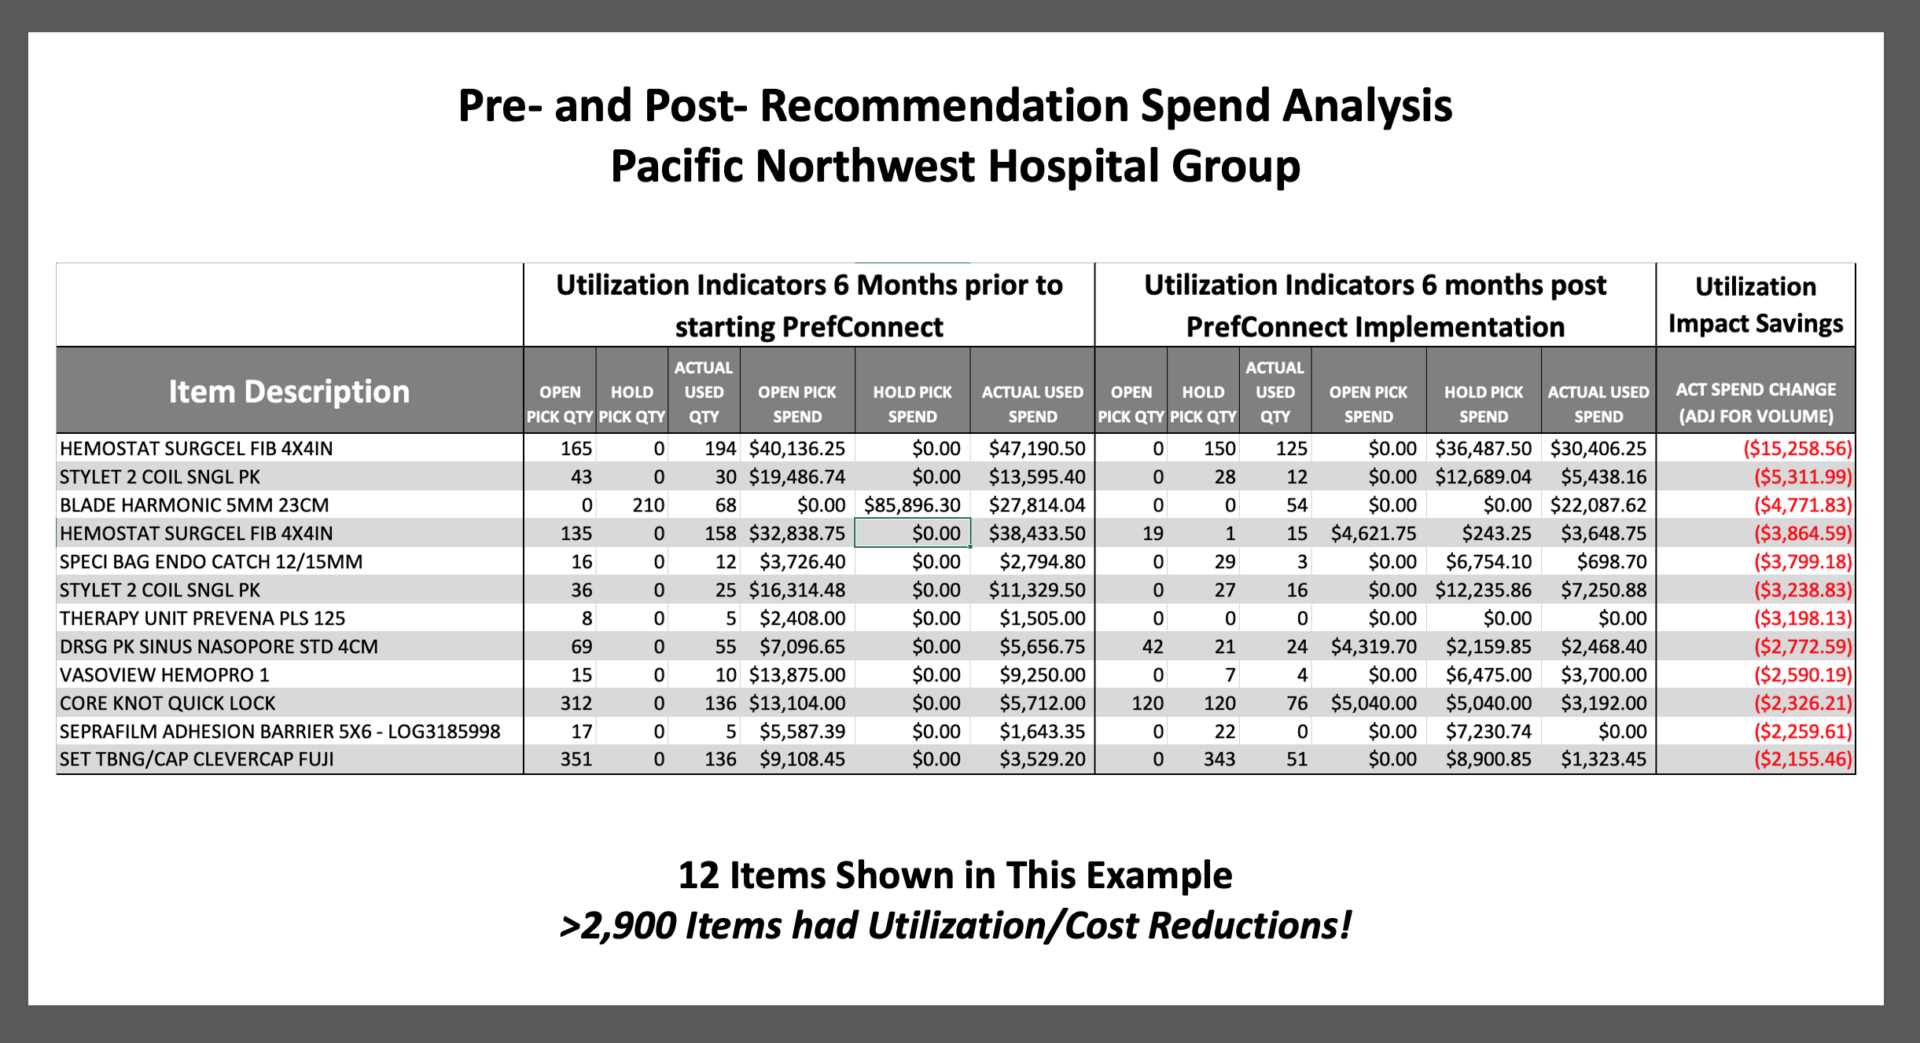
And these validated, quantified improvements are in addition to improvements related to the reduction of touchpoints. Look at “HEMOSTAT SURGCEL FIB 4X4IN” (item 4 above) for example. The Open Pick Quantity prior to PrefConnect was 135. After PrefConnect it is just 19. The reduction in touchpoints means significant reductions in labor and risk, resulting big improvements in efficiency. On top of the quantified, validated direct savings.
We think this is a game-changer.
Without the proper data and analytics, curbing waste through better utilization has been a frustrating endeavor and a historical challenge. The ability to identify areas of under-utilization and waste was simply not there. As a result, the focus time and again has been to drive down price. As Maslow famously noted, “When the only tool you have is a hammer, everything looks like a nail.”
No Matter How Low the Price, It’s Still Wasted if You Don’t Need to Buy It.
PrefConnect’s pre- and post-recommendation analysis has the potential to revolutionize the way that hospitals look at supply chain utilization. Because until recently this kind of utilization analysis had been, in practical terms, impossible, the focus of improvements in supply utilization tended to focus almost exclusively on price. Driving down the prices from vendors was (and for most, still is) is the primary tool that supply chain managers have to control surgical supply costs. In some cases, it is the only tool being used. But what if, instead of solely focusing on getting a lower price, the hospital simply does not purchase those unused supplies?
Making smarter decisions about what supplies to purchase, how many to purchase, and – perhaps more importantly – what not to purchase have been historically challenging due to a lack of data and the tools to analyze, quantify and validate the benefits. Those days are over. It’s time to add another, more sophisticated, data-driven tool to your supply utilization toolkit.
Pre- and post- supply recommendation analysis and reporting is now a standard feature of PrefConnect’s cloud-based preference card management solution.
[i] https://thejns.org/view/journals/j-neurosurg/126/2/article-p620.xml
[ii] https://www.beckershospitalreview.com/digital-health/digital-preference-cards-for-surgeons.html
[iii] https://www.sciencedaily.com/releases/2014/10/141027144524.htm